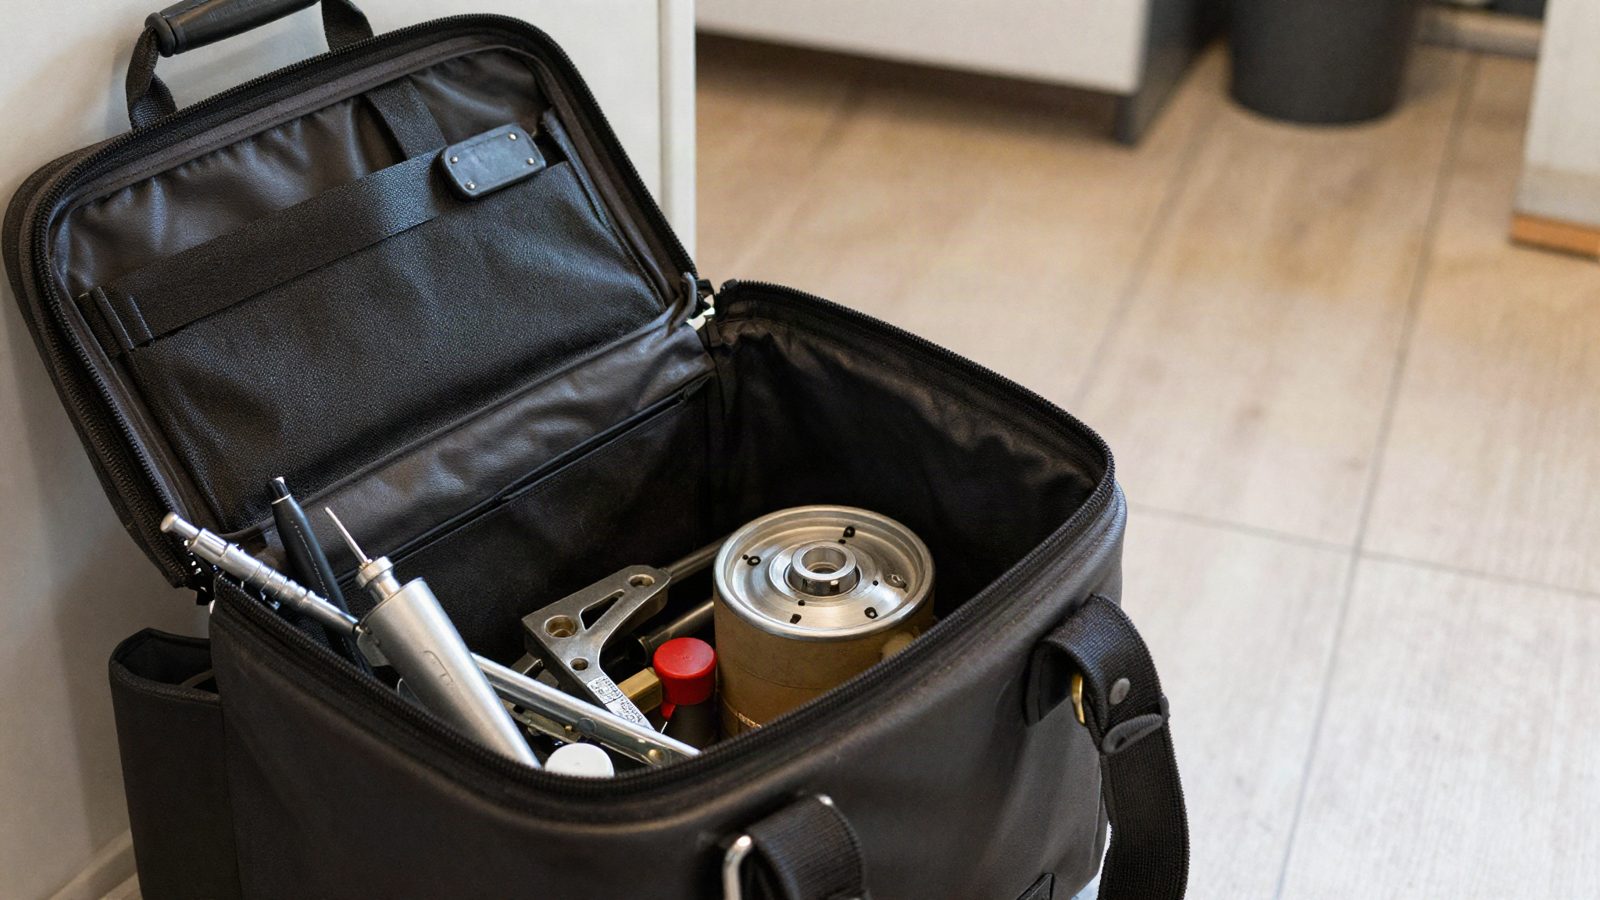
A stockout does not cost the price of the part. It costs a second visit, and the second visit has 6 components: travel, labor, the slot it displaced, the admin around it, the customer's downtime, and the account risk. Most service companies price only the first two.
The short version
Every service company knows a return visit is expensive and very few can say by how much, which is why the parts investment that would prevent it never gets made.
The number matters because it is the argument. A service company that knows a return visit costs a specific amount can decide rationally whether to carry a part, expedite a delivery, or accept the wait. A service company that does not decides on feel, and feel underweights the parts that stop kitchens.
This page is a method rather than a benchmark. Any article quoting you a dollar figure for a stockout is guessing at your labor rate, your drive times and your customer mix.
The 6 components of a second visit
Work these out once with your own numbers and the result stays useful for a year.
| Component | How to work it out | Usually |
|---|---|---|
| Travel | Round trip time at your loaded labor cost, plus vehicle cost per mile | Counted |
| On-site labor | The second visit's wrench time, which is short because the diagnosis is done | Counted |
| The displaced slot | What that time on the board would otherwise have earned | Not counted, and often the largest |
| Admin | Rescheduling, the customer call, the second job record, the second invoice line | Not counted |
| Customer downtime | Their loss, not yours, and it decides whether they call you next time | Not counted |
| Account risk | Response and first-time-fix scores on portal work, where they are measured | Not counted until it bites |
The third row is where most of the money is. A return visit does not add capacity, it consumes it. On a full board, that hour was going to be billable work, and the second visit is usually not separately billable at all.
The last row applies specifically to national account and facilities-managed work, where first-time fix is a tracked metric rather than a virtue. There a pattern of return visits shows up in a scorecard before it shows up in a conversation.
Doing the arithmetic with your own numbers
Four inputs, all of which you have.
- Your loaded hourly cost for a technician. Wage plus employment costs plus vehicle, not your charge-out rate.
- Average round trip time for a return visit. Use your real service area rather than an average of the map.
- Your billable rate, for the displaced slot.
- Admin time per return, honestly. Rescheduling and the second invoice take longer than anyone estimates.
Multiply and add. The result is one number, and it is the number to compare against the cost of carrying the part that would have prevented it.
Then run it against your own history. Pull the last quarter's jobs that needed a second visit for a part, count them, and multiply. That total is what a stockout problem costs your business per quarter, and it is usually larger than the entire van stock investment being debated.
Not every stockout is preventable, and that matters
Splitting them is what turns a number into an action. Three categories, and only one is a stocking decision.
Preventable by stocking. A part you fit regularly, available from your supplier, that simply was not on the van or the shelf. This is the category the van list exists to shrink.
Preventable by diagnosis. The technician did not know which part was needed before arriving, so nothing could have been carried. The fix here is not stock, it is better information before dispatch, which usually means the equipment record and the fault history.
Not preventable. A control board for a model you see twice a year, with a four day lead time. Carrying it would be dead money. What is manageable here is the customer conversation rather than the wait.
Most service companies treat all three as a stocking failure and buy their way at the wrong problem. Categorizing a quarter of second visits takes an hour and it tells you which of the three is actually yours.
The diagnosis category is bigger than service companies expect
A technician arriving without knowing what failed cannot carry the right part, however good the van list is.
What closes that gap is information available before the van leaves. The equipment's manufacturer, model and serial number, what has been done to it before, and whether the same fault has been through already.
A dispatcher who can see that a walk-in at store 212 had its condenser fan motor replaced eight months ago sends a technician with a different expectation from one who knows only the address. That is not a stocking improvement and it reduces second visits.
Holding manufacturer, model, serial number, service history, location history and warranty agreements against the equipment rather than the customer is what makes that possible. It is also why repeat-failure patterns are visible at all, which is a related use of the same records.
What to fix first
In order, because the first two are free.
- Capture the reason. Add a field to every second visit: stocking, diagnosis, or unavoidable. One quarter of data tells you where to spend.
- Get the equipment history to the dispatcher. Most service companies have the information and it is not where the decision is made.
- Fix the van list for the stocking category only. Add the parts that actually caused return visits, not the ones that feel prudent.
- Agree an expedite rule. When a part is worth overnight freight and who decides. This is a policy question and it is usually never answered, so nobody expedites anything.
The fourth is the cheapest win in the list. Overnight freight on a part that prevents a second visit is frequently less than the number you calculated above, and service companies decline it because the freight cost is visible and the return visit cost is not.
Roopairs holds parts inventory alongside purchase orders and the equipment record, which is what makes both the stocking and the diagnosis categories addressable from the same place. Ray has written about why they belong with the work order.
Measuring first-time fix without a project
First-time fix rate is the metric behind all of this and it is simple to start counting.
Of the jobs completed last month, how many needed a second visit for any reason. That percentage is your baseline and it does not need to be precise to be useful.
Track it monthly alongside the reason split. The number itself moves slowly. What moves faster, and what tells you whether the changes are working, is the balance between the three reasons.
Roopairs runs a product tour where you can look at a job that needed a second visit and see what the dispatcher would have known with the equipment's history in front of them.
What service companies in the trade say
“Roopairs makes it easy for myself and my employees to keep records of each customer, every part number, cost, equipment details, names, order requests, estimates, you name it- all kept on file in one place. This app saves my company and me tons of time.” — A&E Refrigeration
Also worth reading
- When Parts Tracking Starts Paying for Itself
- What a Callback Really Costs You
- Should I use OEM or non OEM commercial kitchen parts
Frequently asked questions
What does a parts stockout cost a service company?
Far more than the part, because it causes a second visit. The components are travel, on-site labor, the billable slot that visit displaced, the admin around rescheduling, the customer's downtime and, on portal work, the effect on your first-time-fix score. Work it out with your own labor cost and drive times rather than taking a published figure.
How do you calculate the cost of a return visit?
Loaded technician cost multiplied by round trip plus on-site time, plus your billable rate for the displaced slot, plus honest admin time. Then multiply by how many second visits you had last quarter to get the figure that matters for a stocking decision.
What is a good first-time fix rate?
Benchmarks published for this vary by trade and definition enough to be unhelpful, and the useful comparison is your own last quarter. What matters more than the level is the split of reasons behind the misses, because stocking, diagnosis and unavoidable each need a different fix.
Should we carry more parts to avoid stockouts?
Only for the stockouts that stocking would have prevented, which is usually less than half of them. Buying stock to solve a diagnosis problem raises cost without raising first-time fix, and it is the most common overcorrection in this trade.
When is overnight freight worth it?
Whenever it costs less than your calculated return visit, which is more often than service companies assume. The reason it gets declined is that freight appears on an invoice and a return visit does not, so agree a rule in advance rather than deciding each time under pressure.
How do we reduce stockouts without carrying more stock?
Get better information to the dispatcher before the van leaves. Knowing the equipment, its history and the likely fault lets a technician carry the right part rather than more parts. That is the diagnosis category, and it costs nothing beyond having the records in the right place.
See how Roopairs can help your service business scale
The all-in-one platform built for commercial kitchen service companies. Dispatch, invoicing, parts ordering — all in one place.
Book a product tour →